Usage
From the Instance on the Side Navigation choose Usage.
Usage is part of the Autoscaling information.
The data is displayed for the calendar month, from the first to the last day of the month. This allows for comparing the data consumption with the Fair Use Policy and identifying potential issues and anomalies.
The available metrics shown on the charts are:
- Bandwidth (TB)
- Logs volume (GB)
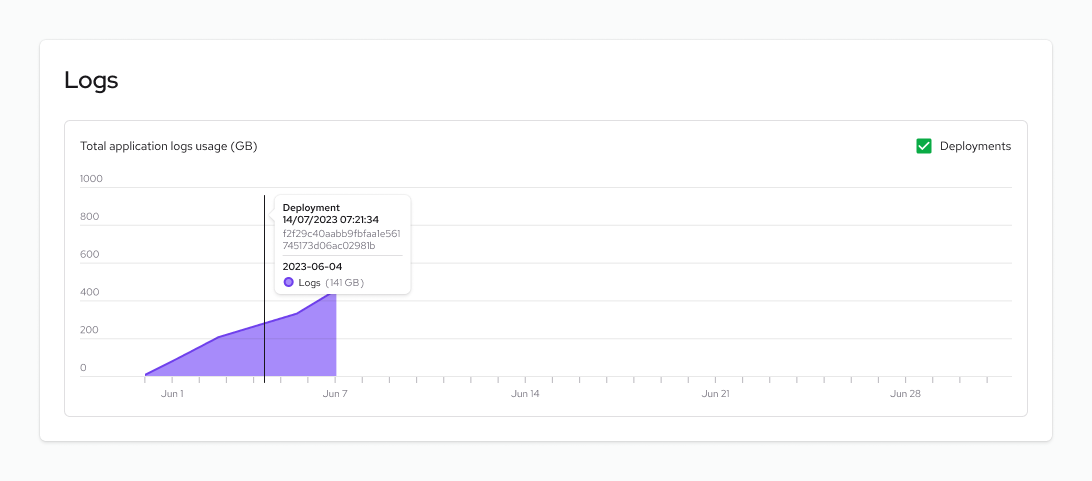
When on, the Deployments toggle will display vertical dotted indicators on the charts. These indicators show the exact date when a deployment was done, making it easier to correlate a change in logs/metrics charts with a certain deployment.