Logs
From the Instance on the Side Navigation, choose Monitoring -> Logs.
Logging is an essential feature, it provides a detailed record of all server and website activity. Server logs capture important information, including the date and time of each request, the IP address of the requester, the type of request made, and the status of the request.
Logging is critical for several reasons. Firstly, logs are essential for troubleshooting issues that may arise on the server or website. Secondly, logs provide an invaluable tool for monitoring the performance of a website or server. You can detect patterns in website traffic and usage that could affect performance, which can be used to optimize the website for better performance and efficiency. Finally, logs can be used for security purposes to detect and investigate security incidents such as unauthorized access attempts or malicious activity.
How to work with logs?
Logs in the Alokai console allow you to check logs from multiple sources and filter them by specific criteria.
Let's see what's possible and how to use it.
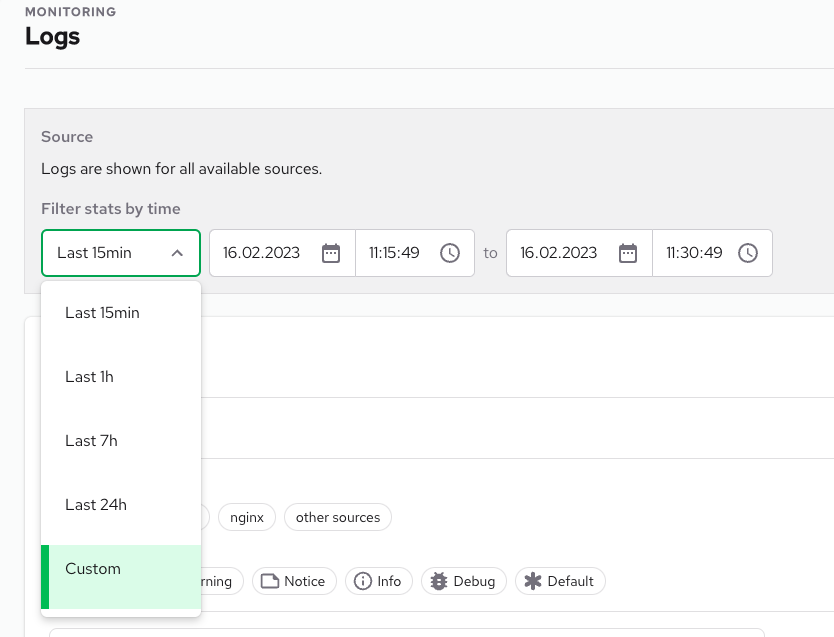
Date pickers
You can apply filters to metrics for a specific time period. There are two ways to set the time period:
- Using a pre-defined range, such as the last 15 minutes.
- Setting a custom period of time that suits your needs.
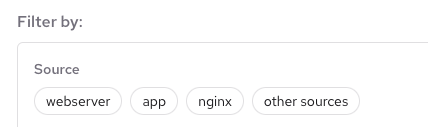
Sources
Sources are the main filter options.
Before we start analyzing the website, it is worth knowing what the structure of the application is. More information about the architecture can be found in the Alokai cloud architecture docs page
In short, your instance collects data from multiple sources, and you can check and analyze logs at multiple levels.
loadbalancer
This is our ingress filter, which holds useful information about requests, for example, latency, "referer" headers or remote IP.
app
This is your main Alokai application. Filtering by this source allows you to check what's happening in your SSR application logs.
nginx
This source is a reverse proxy for your Alokai application and every additional application
other sources
This source groups additional application logs.
Severity
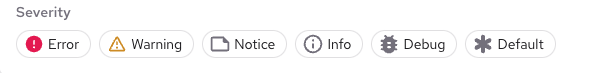
This filter allows you to check only the most important indicators, such as errors. Errors can mean different things depending on the source:
- in nginx and ingress, this means an HTTP status code and is defined as follows:
| Severity type | HTTP status criteria |
|---|---|
| Error | >= 500 |
| Warning | >= 400 AND < 500 |
| Notice | >= 300 AND < 400 |
| Info | < 300 |
| Debug | - |
| Default | - |
- in your Alokai app, this means a different type of error or logs put to stdout or stderr
Search
The search feature allows you to filter queries by specific criteria, which will filter your data by the URL and message info of the log.
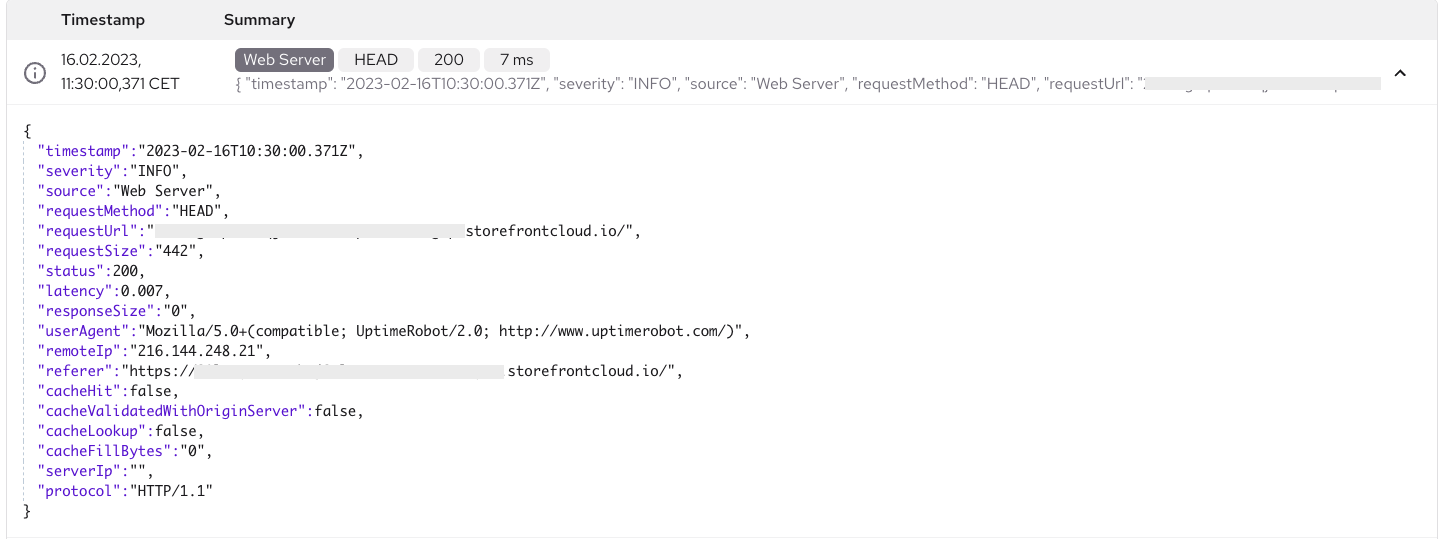
Logs table
The most interesting data are in the table. We prepare and show you two different types of data in the table:
1. A JSON object with all key-value results:
2. A simple text message:
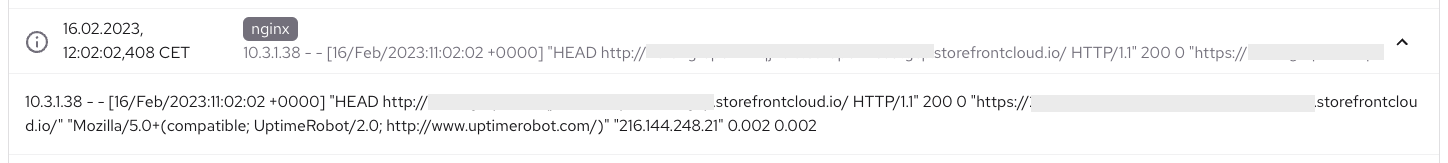
All data are collapsed, and you can open more details by clicking on them.
Useful cases
Here are some common use cases for working with logs:
1. Sharing logs between members
When you start working with logs and filter them, you can share the URL link to the filtered logs with other organization members to investigate what happened.
2. Finding performance issues
You can easily check the performance of your application and identify performance issues, such as latency for a single URL, and what happened with it during a specific period of time.
3. Identifying security issues
You can use the logs to find a lot of information about unauthorized requests and identify ways to protect your instance from them. For example, you can use logs to detect brute force attacks or other types of malicious activity.
Download Logs
You can download logs to a .json file. To do this, select the Logs button above or below the log list, then enter how many logs you want to download (maximum 400).