Metrics
From the Instance on the Side Navigation, choose Monitoring -> Metrics.
Metrics are vital for detecting anomalies in system performance. By monitoring parameters against benchmarks, we can identify and resolve issues early, ensuring optimal reliability. Incorporating metric-based monitoring and analysis is essential for maintaining peak performance and reliability.
Metrics in the Alokai console provide real-time graphs that enable you to identify important patterns and behaviors in your instance.
Getting Started
The source selector is located at top of this page. This selector allows you to choose a specific source to obtain comprehensive information about a given instance, without having to sift through irrelevant data.
You can choose between two sources of data:
- Storefront - your main Alokai application,
- Middleware app - not available on all instance.
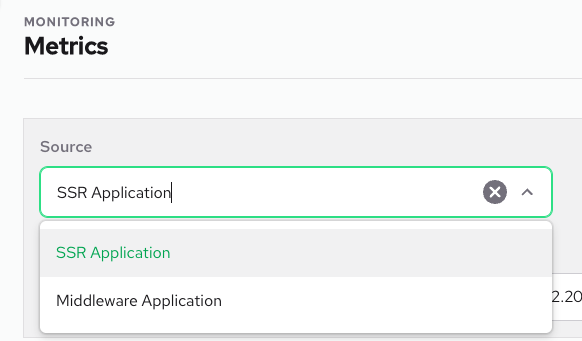
The Middleware Application is an optional application and not available on every instance. If you do not see this option, it means that you do not have this application installed.
Filters
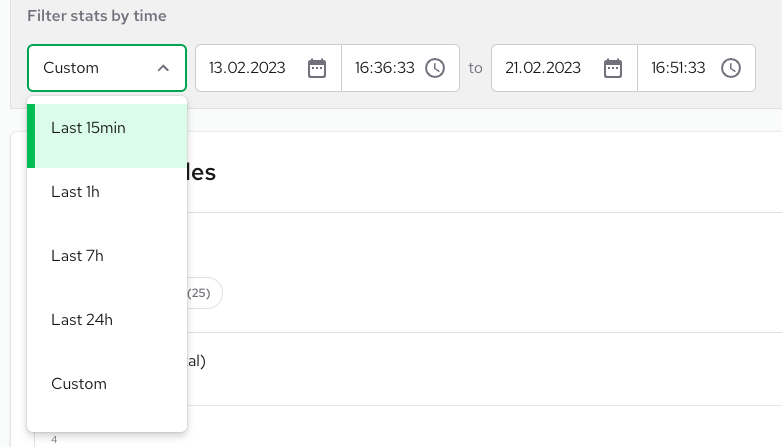
You can apply filters to metrics for a specific time period, and there are two ways to set this time period:
- Using a pre-defined range, such as the last 15 minutes.
- Setting a custom period of time that suits your needs.
Metric Graphs
Visual depictions of your system's condition are critical metric tools for assessing the health of your instance. Diagrams provide an effective way to present data, making it easier to comprehend and interpret.
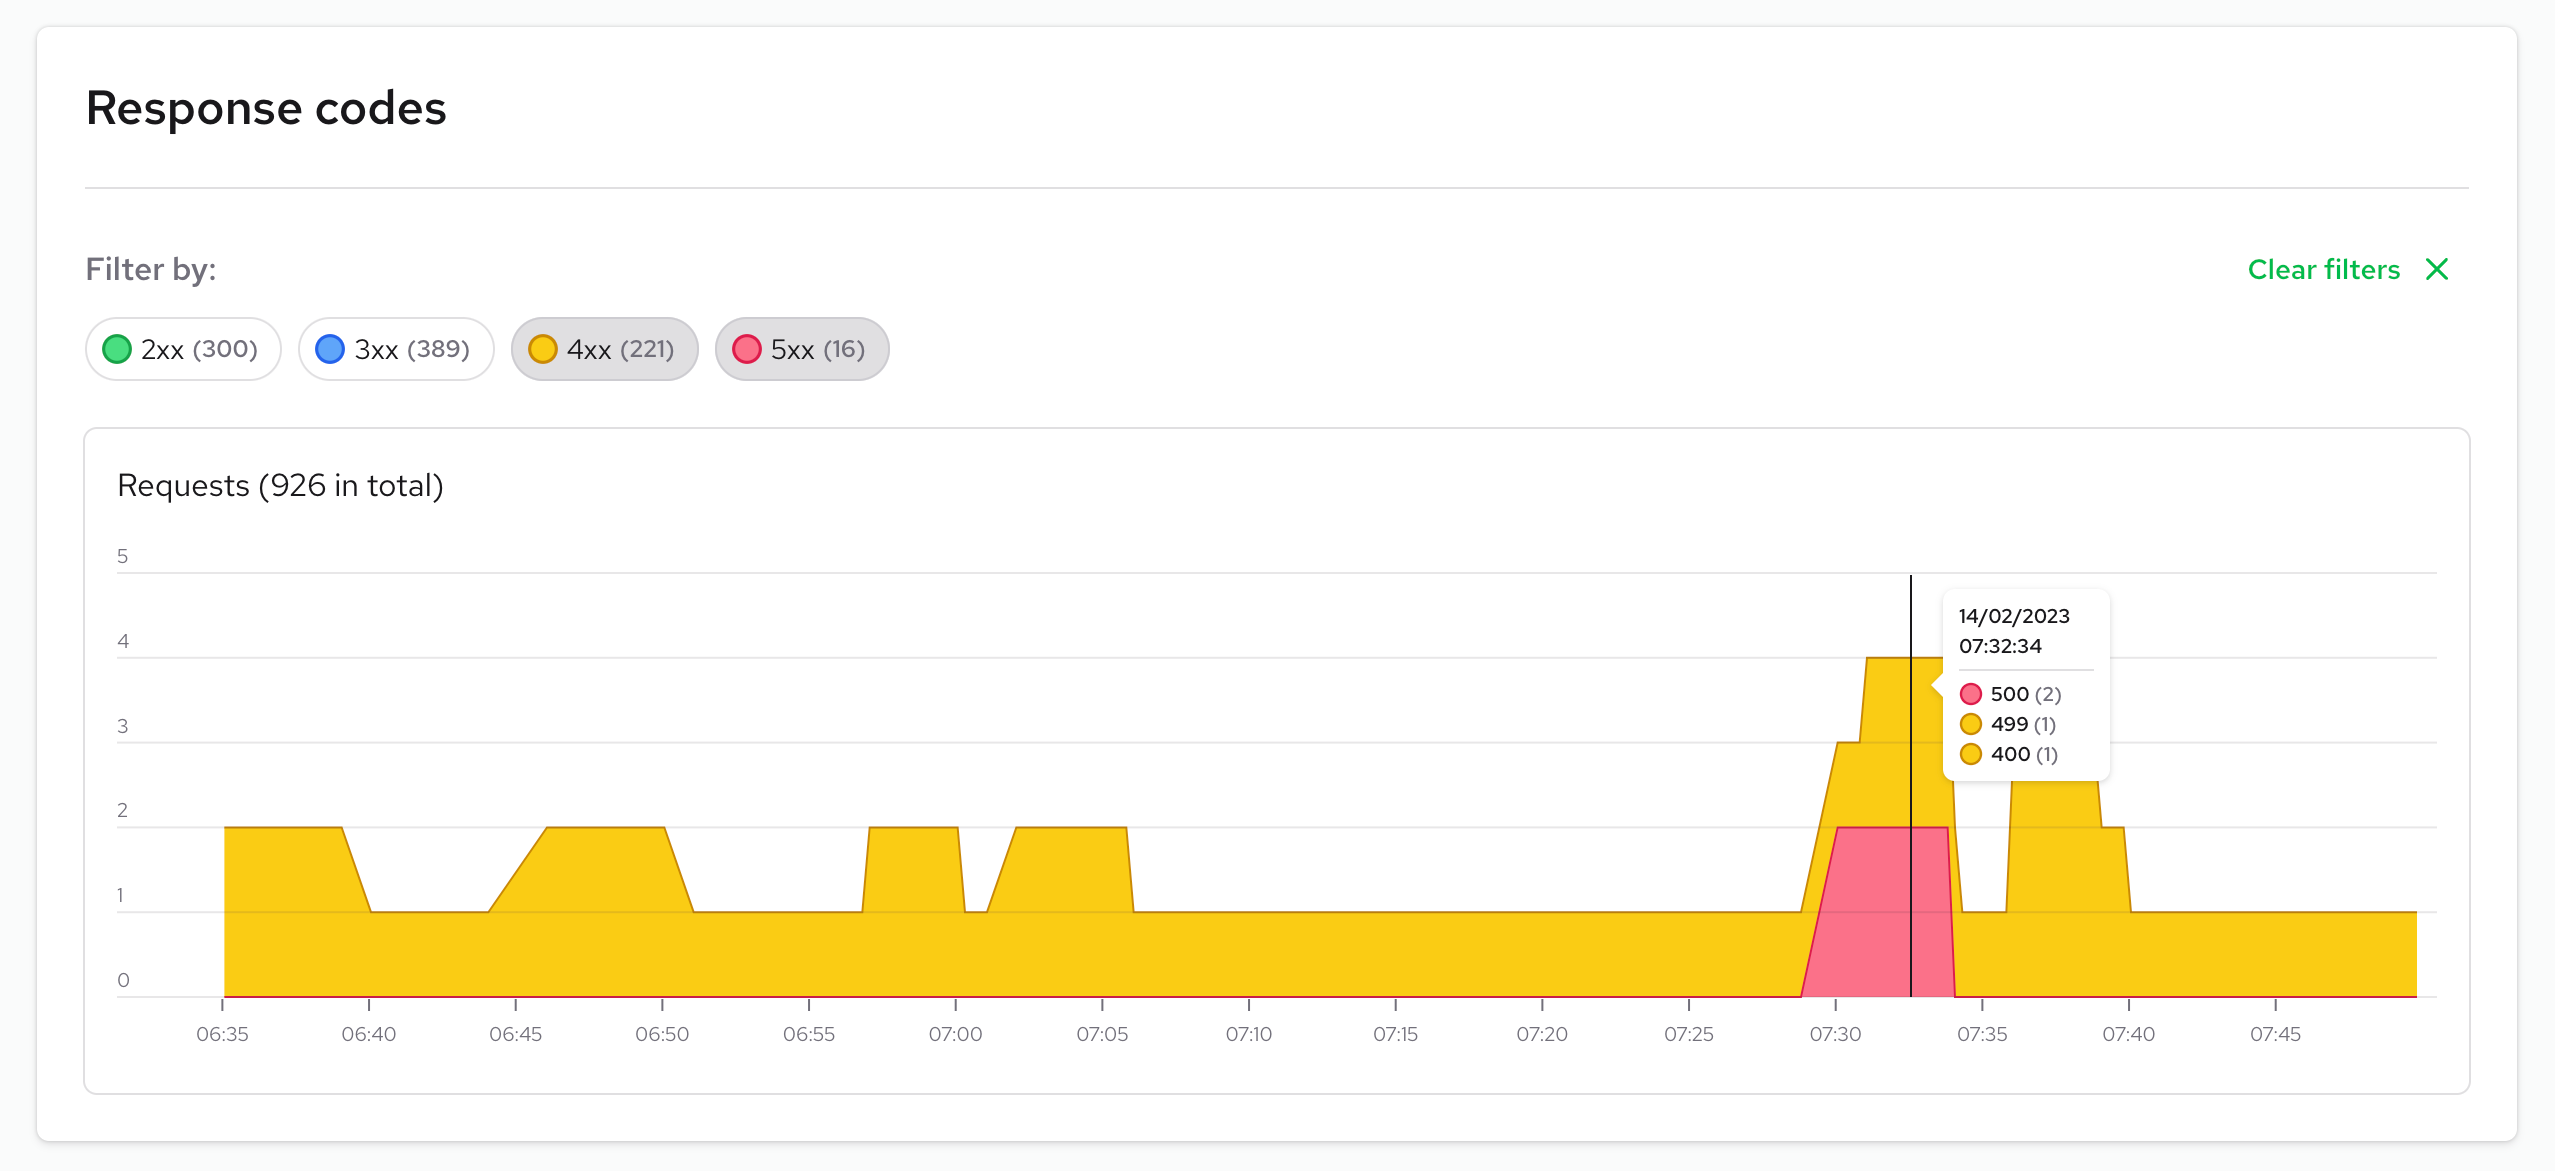
Response codes
You can detect anomalies in responses by their status code. Normal graphs should display only 2xx codes, sometimes 4xx for security reasons, but 5xx means something bad has happened in your application.
These graphs are useful for monitoring what's happening in your instances from client side perspective.
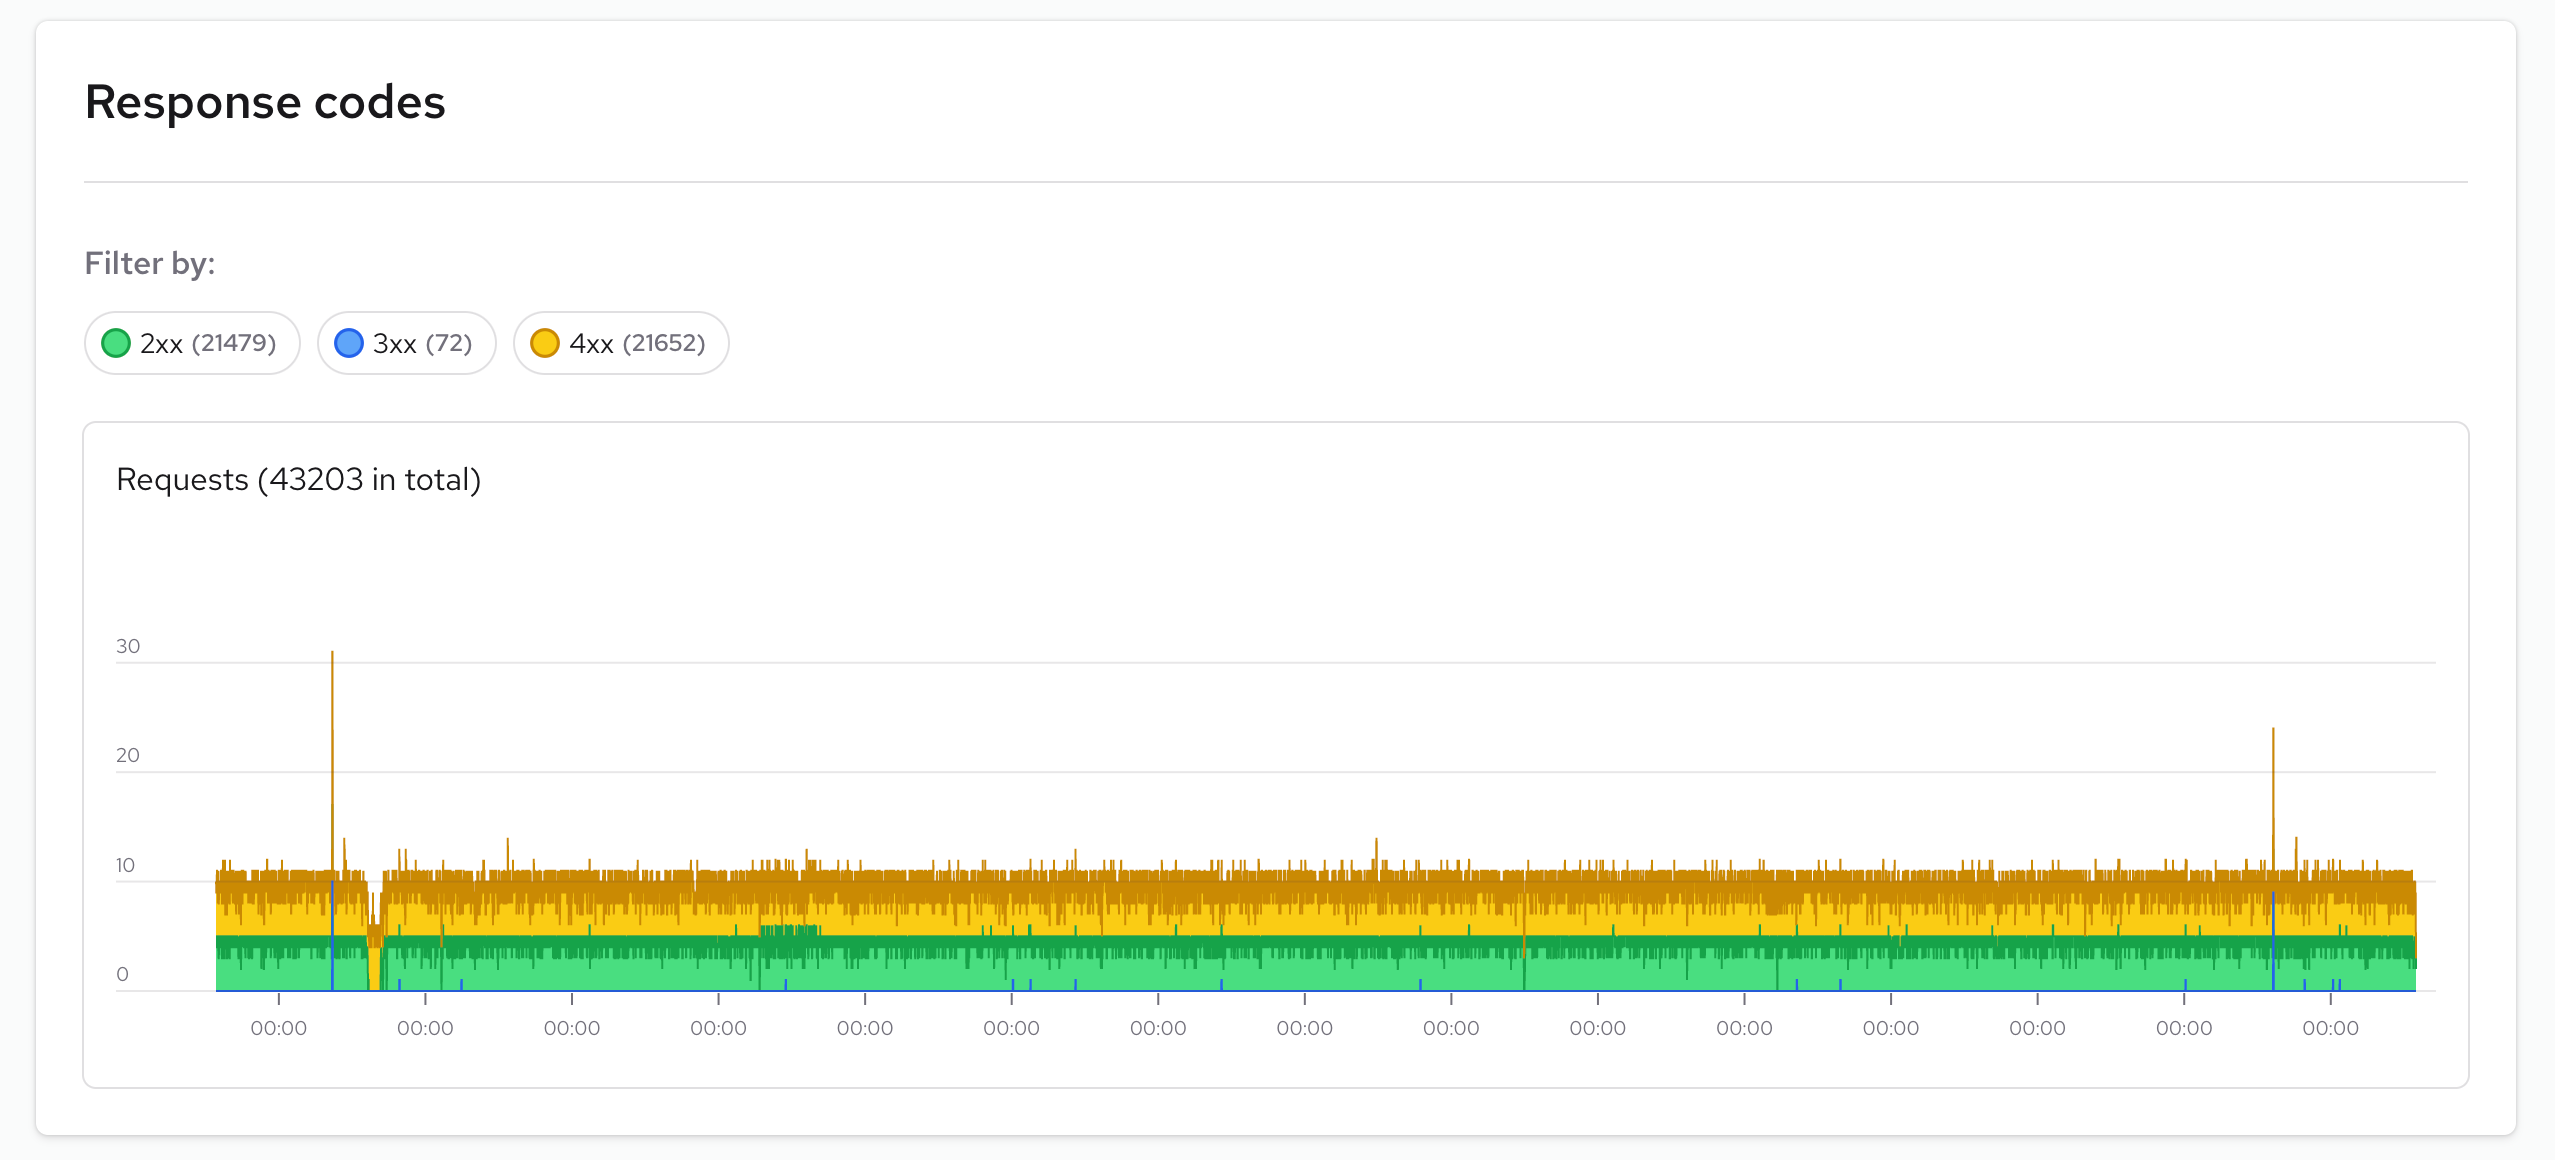
You can filter and select specific response code groups to check how frequently you receive them. For more detailed information, you can check the logs page, where you can discover additional insights about when these events occur.
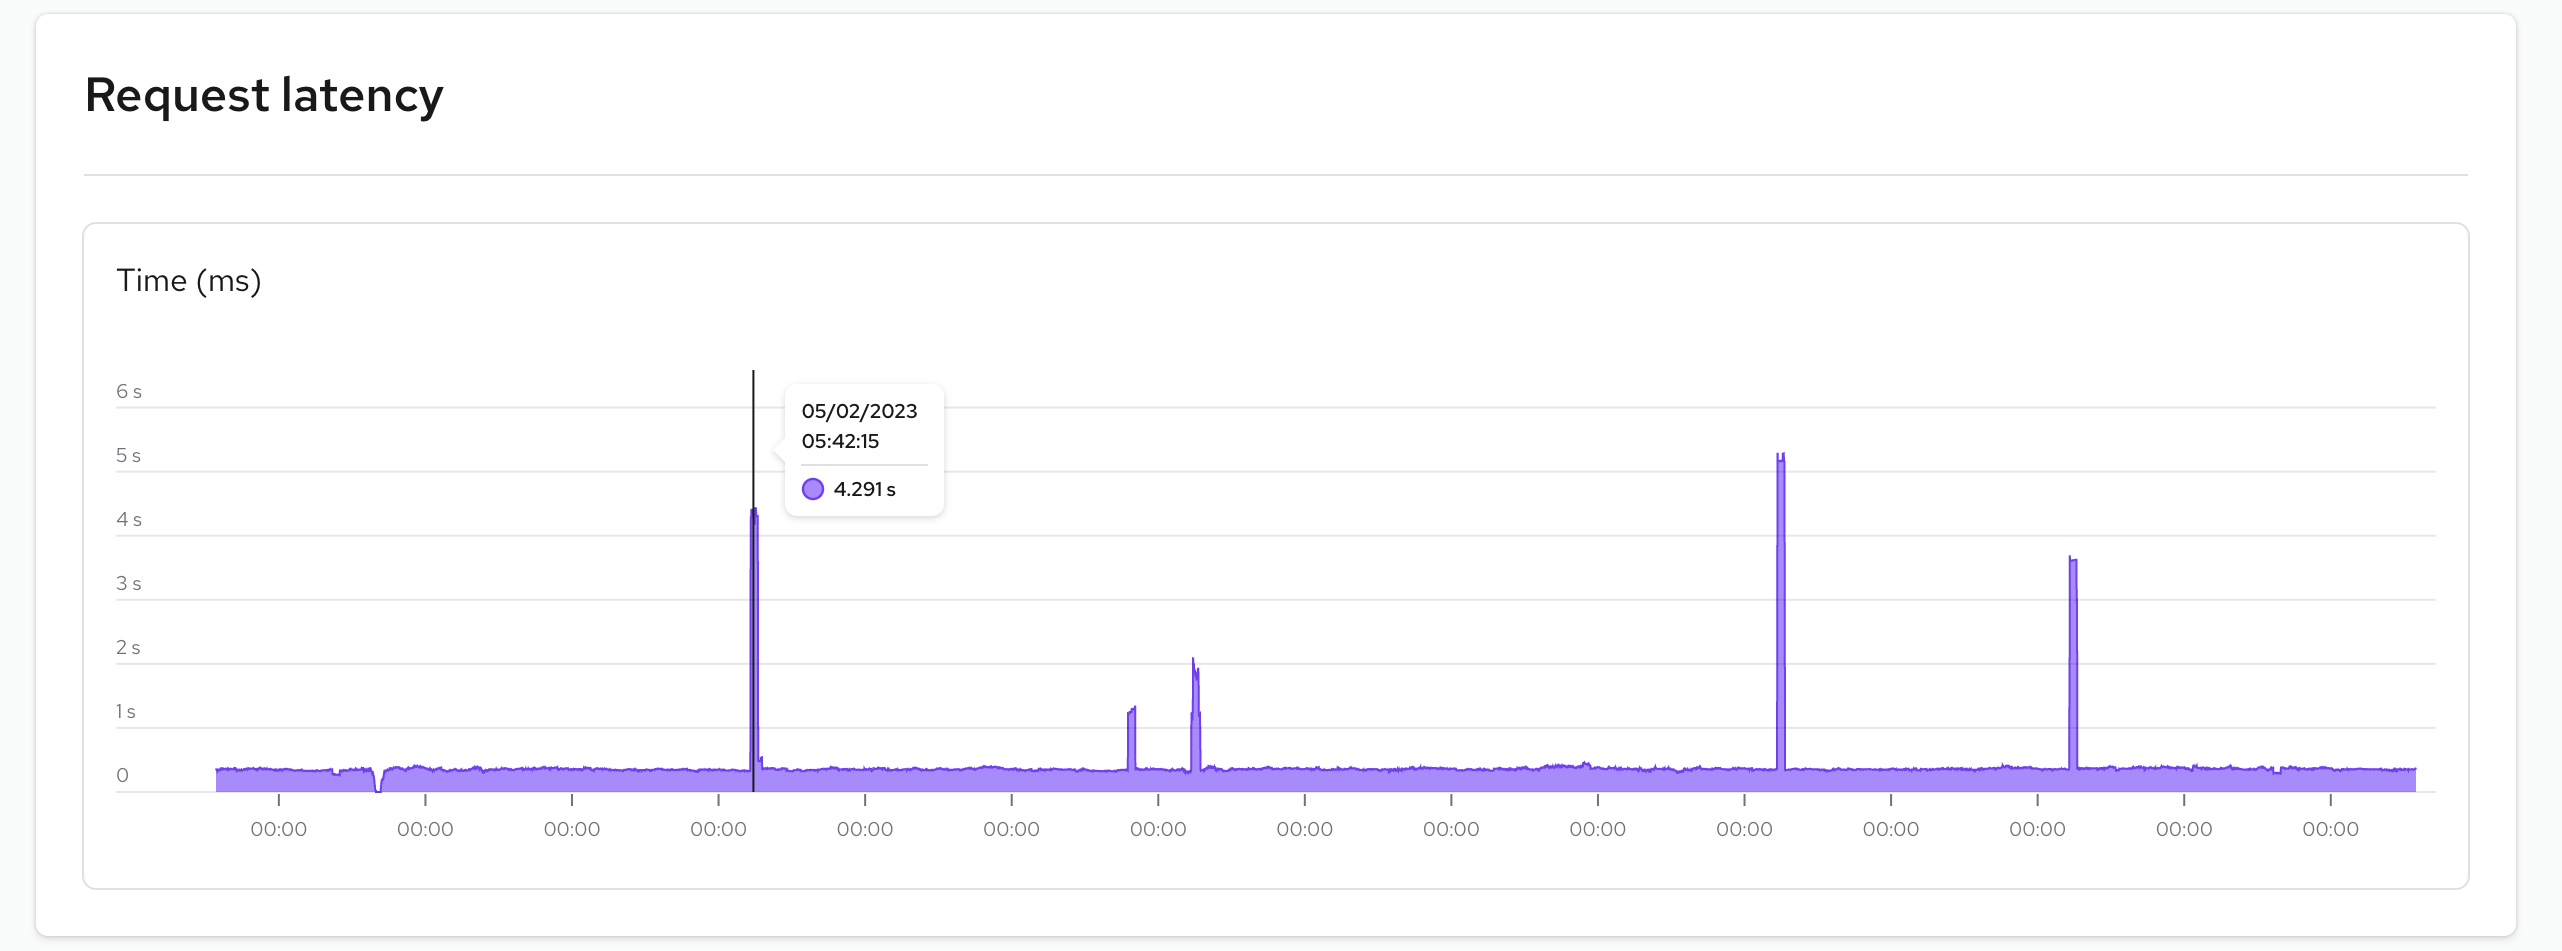
Request latency
The Request Latency graph allows you to visualize the response times of your website. Key indicators here are the "peaks" of the graph. If the peaks are higher than expected it could mean there is a problem with your application or the instance
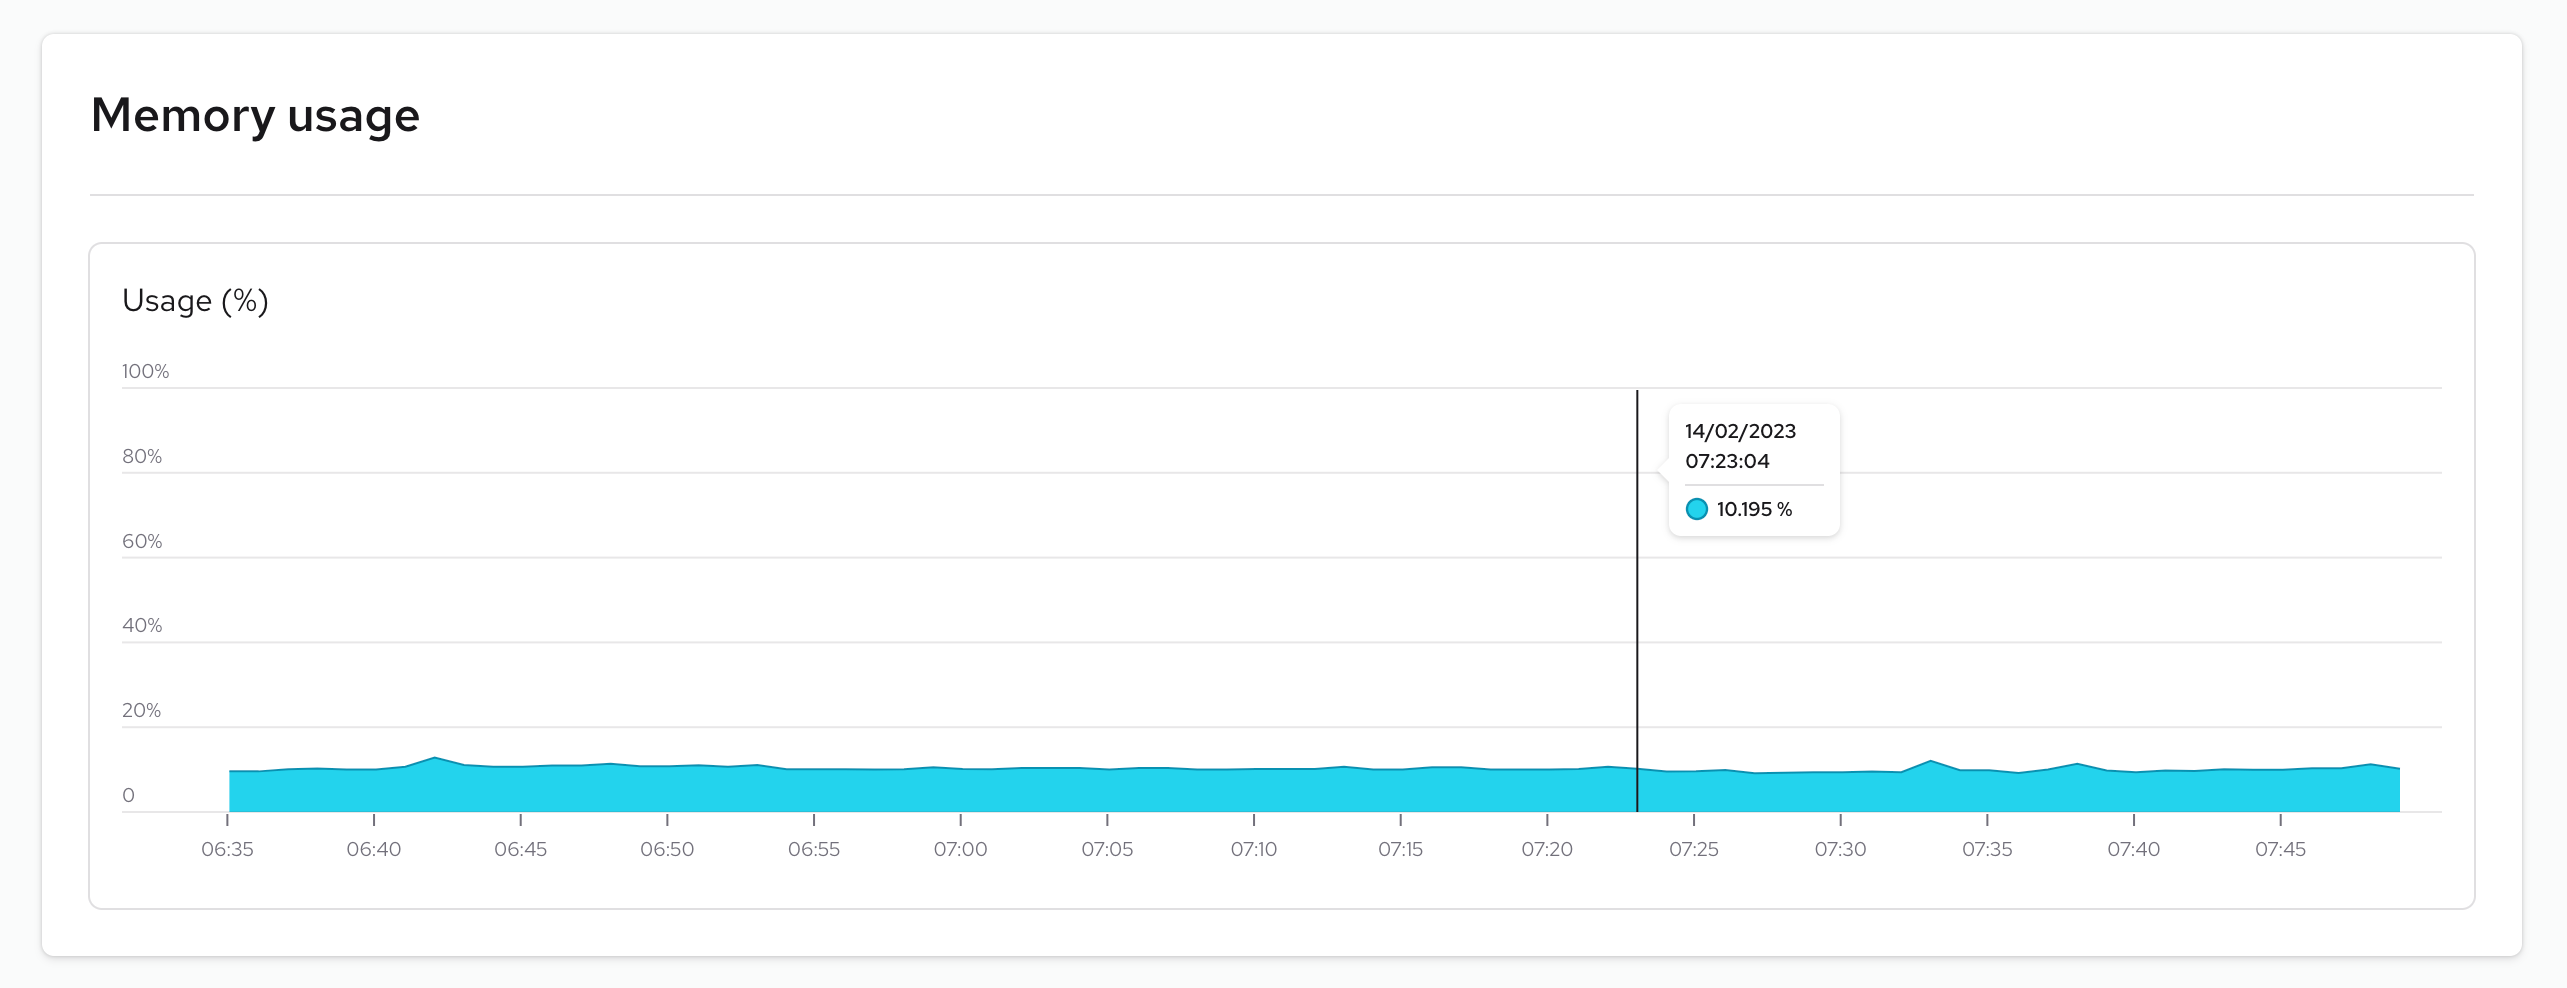
Memory usage
Memory usage refers to the amount of computer memory being utilized by an instance. Monitoring memory usage is critical to detecting memory leaks, which occur when a program fails to release memory that is no longer required, resulting in performance issues and crashes. Regular monitoring of memory usage can help you detect and address memory leaks.
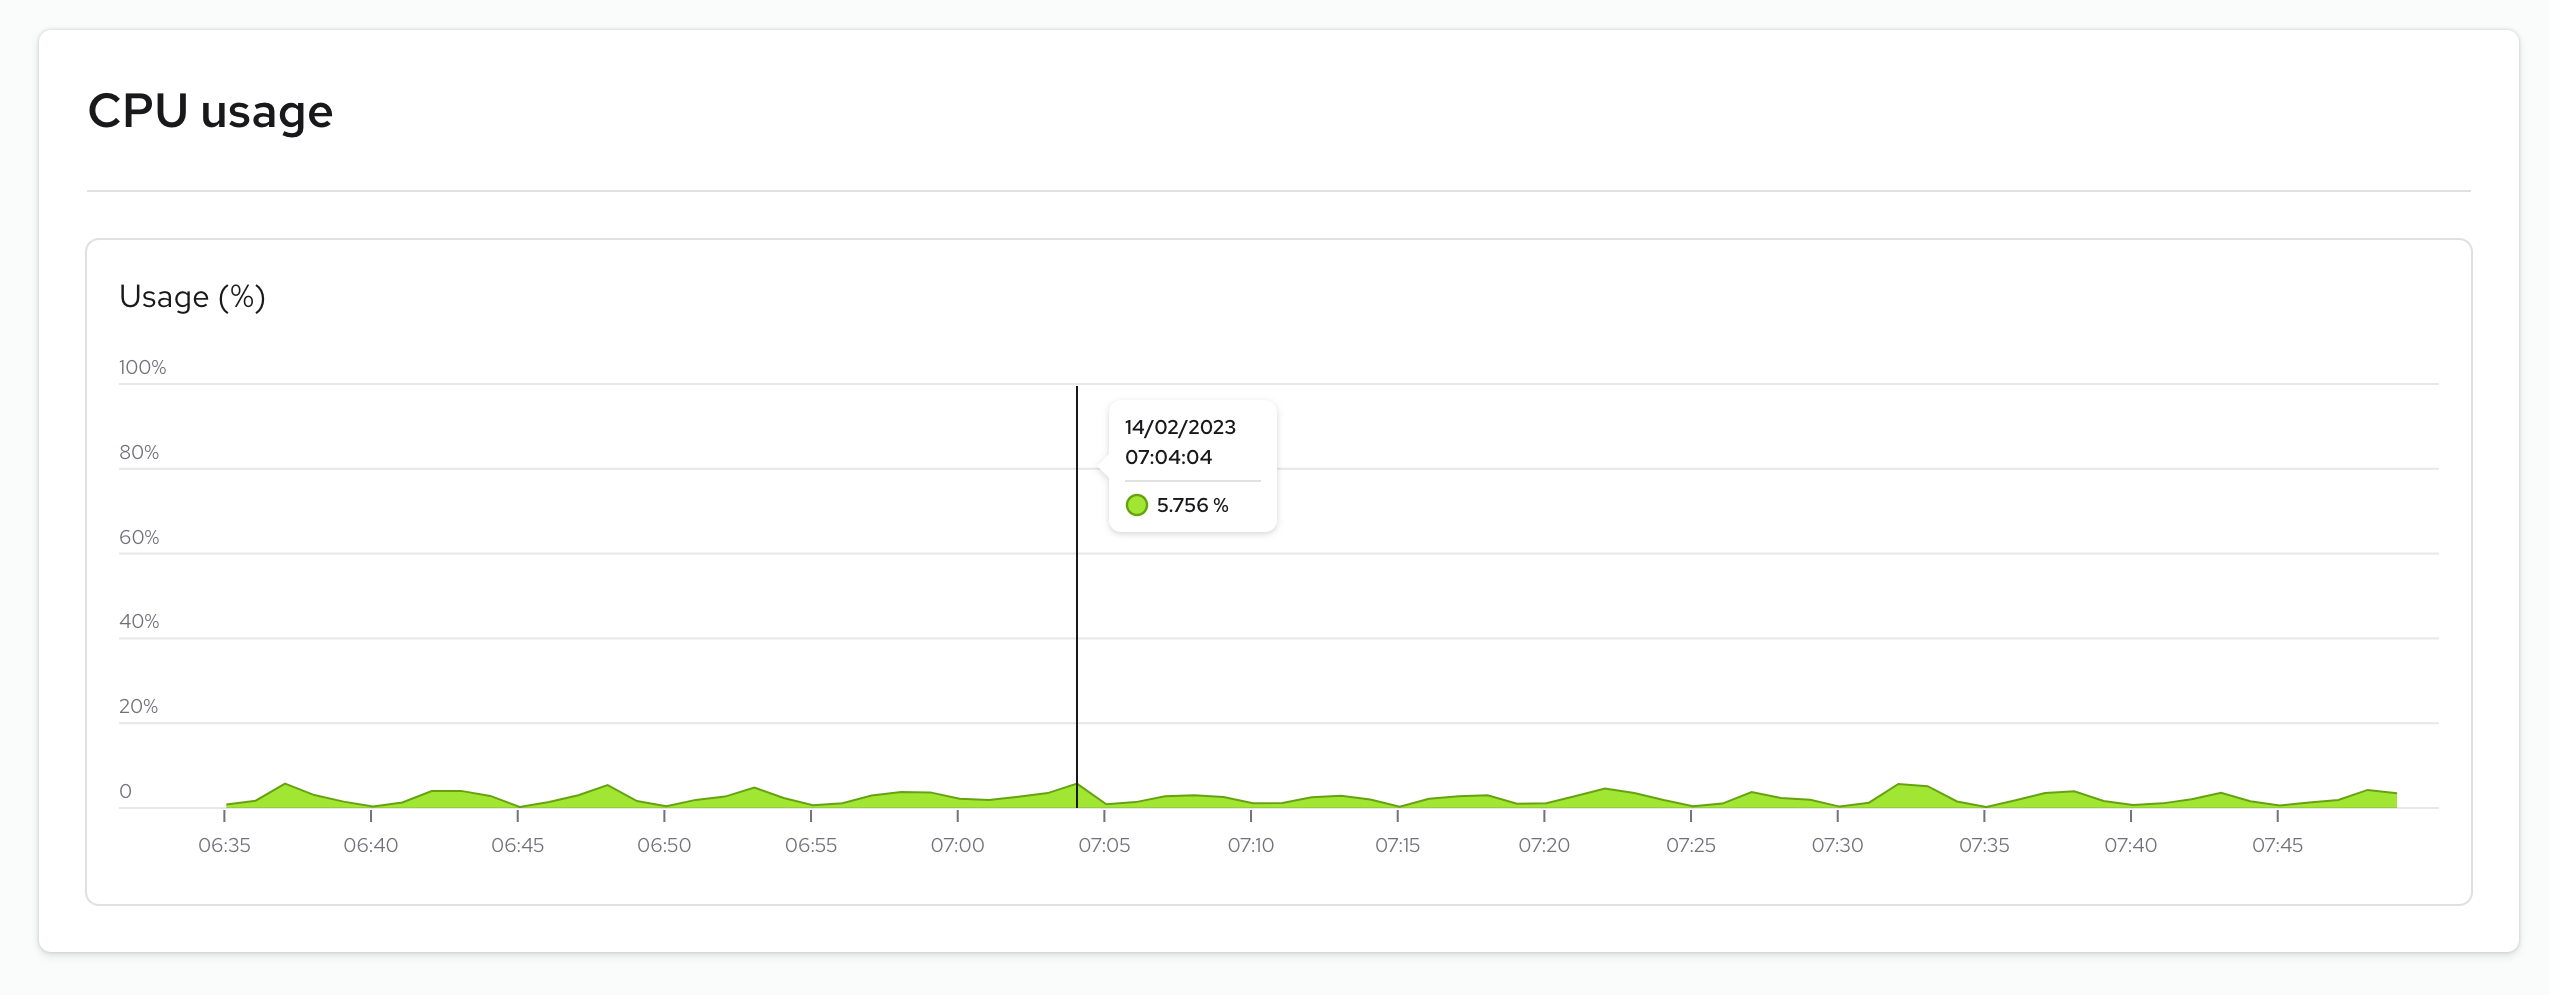
CPU usage
CPU usage provides information on how much CPU your system has utilized. Monitoring CPU usage is crucial because it can help you detect performance issues and potential bottlenecks. High CPU usage can lead to slow performance and increased power consumption, and this metric allows you to identify any anomalies in resource consumption by your instance.