Uptime
From the Instance on the Side Navigation choose Uptime.
Uptime feature is in beta version.
The Uptime service allows you to monitor the health status of an application. You can add up to three endpoints (paths) for up to 6 weeks of historical data. Typical use cases include monitoring specific product pages, categories, and the homepage.
Setting up Uptime
To add a new path for Uptime monitoring, select Add a new Uptime path from the dropdown in the Show Uptime for path input. If you don't see this option, it means you have reached the maximum number of paths for monitoring. In this case, you can either edit one of the existing paths or remove one and add a new path.
The process of adding a new path:
- Select the
hostname- if you don't have any Custom domains added, you can skip this step - Enter the path to the endpoint (you can omit the initial
/; it will be automatically added) - Optionally, provide a name for the added path for easier identification, e.g. "Login Page"
After saving, the page will automatically switch to the newly added path. The presentation of statistics and checks will be populated after a certain period of time.
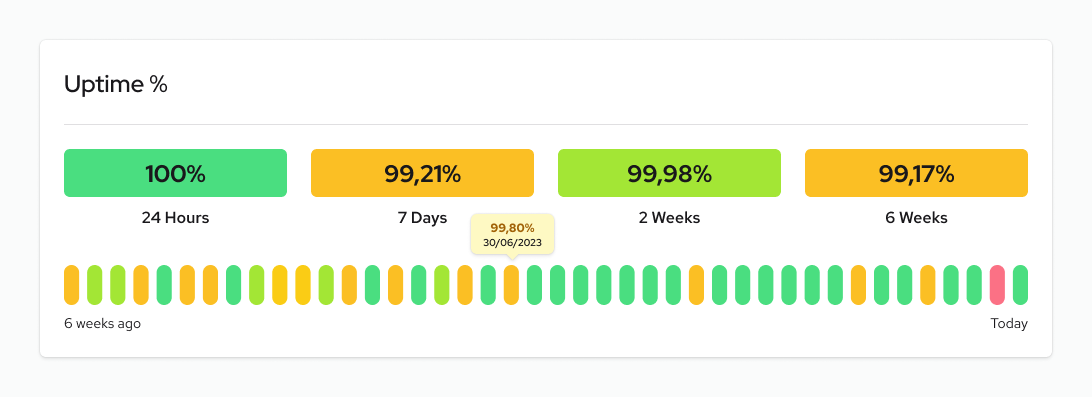
Presentation of Statistics
The monitoring results are displayed in two rows:
- Four tiles for significant time ranges: last 24 hours, 7 days, 2 weeks, 6 weeks
- Data for each day goes back up to 6 weeks (detailed information is available on hover)
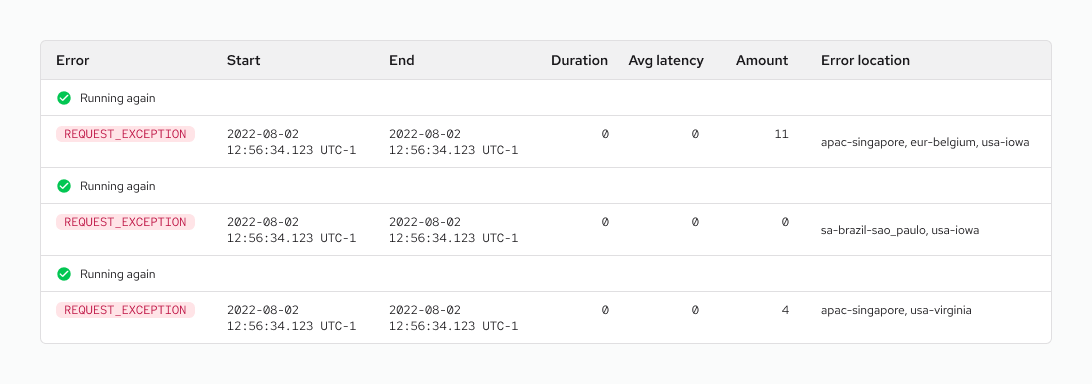
Checks
Detailed logs for the selected path in the Show Uptime for path input. They allow for analysis and correlation of Uptime monitoring results with logged events. The time filter enables narrowing down the range of logs for easier browsing.
Troubleshooting
If there is no data in the statistics and checks presentation, or if Uptime indicates complete downtime, it may be due to the following reasons:
- A new endpoint with a monitoring
pathhas been recently added and there is no data yet - The specified
pathis not publicly accessible or is hidden behindbasic auth(see -> Security) - The specified
pathis incorrect
Otherwise, please contact Customer Success for further assistance.